Does housing have an influence on people’s well being and happiness? Could the 33 boroughs of London allow us to uncover the housing and neighborhood conditions that make people happy?
Housing is an important component of everyone’s life. After all, your home is where you spend most of your time, particularly in these trouble times. Does your neighborhood, that you have now come to know by heart since lockdown, contribute to your happiness?

Why this study?
Cattaneo and al., in their paper Housing, Health and Happiness, discuss the influence of housing on health and welfare by studying the impact of a large-scale household Mexican government program, Piso Firme. That program aimed to replace household dirt floors by cement floors to improve standards of living. What is particularly interesting for us is that they found that housing upgrades significantly improve adult welfare, as measured by an increased satisfaction with their housing and quality of life, as well as lower depression and perceived stress. This raises an interesting point: How does their findings generalize to other cities? Is it possible to establish links between housing and well-being in a big European city? We decided to extend their work by looking at data about housing in London.
We explore the possibility to find such an influence from housing in the London boroughs. If the context of this second study is certainly different from theirs (the housing conditions in these two countries are rather different), this second study also compares information of small closely related locations (London boroughs instead of two twin cities of Mexico) to uncover the influence of housing conditions on their inhabitants’ life in these neighborhoods. We won’t look at health-related happiness in the same way, as this first paper investigates issues that do happen in the London, but mostly not due to housing conditions (anemia, parasites, …). However, life satisfaction and happiness indices, and overall well-being, can still be investigated in relationship to other housing conditions.
What if we could establish the influence of numerous housing variables, such as prices, neighbourhoods (and conditions) on your life satisfaction, anxiety levels and happiness in the city of London? We would be able to tell you where you should live to make your life great!
But also, can politicians use your housing and neighbourhood conditions to know if you will vote for them? We further extend our research on whether political opinion is defined by these conditions. We investigate whether some significant differences can be found between neighborhoods controlled by Labour or Conservative parties.
Index
- Does location define well being or is it defined by standard of living (job, house price)?
- Can we group neighborhoods by looking at well being, security and economic stability?
- Is political control based on well being and housing conditions?
- What does this mean for us?
A first look at our data
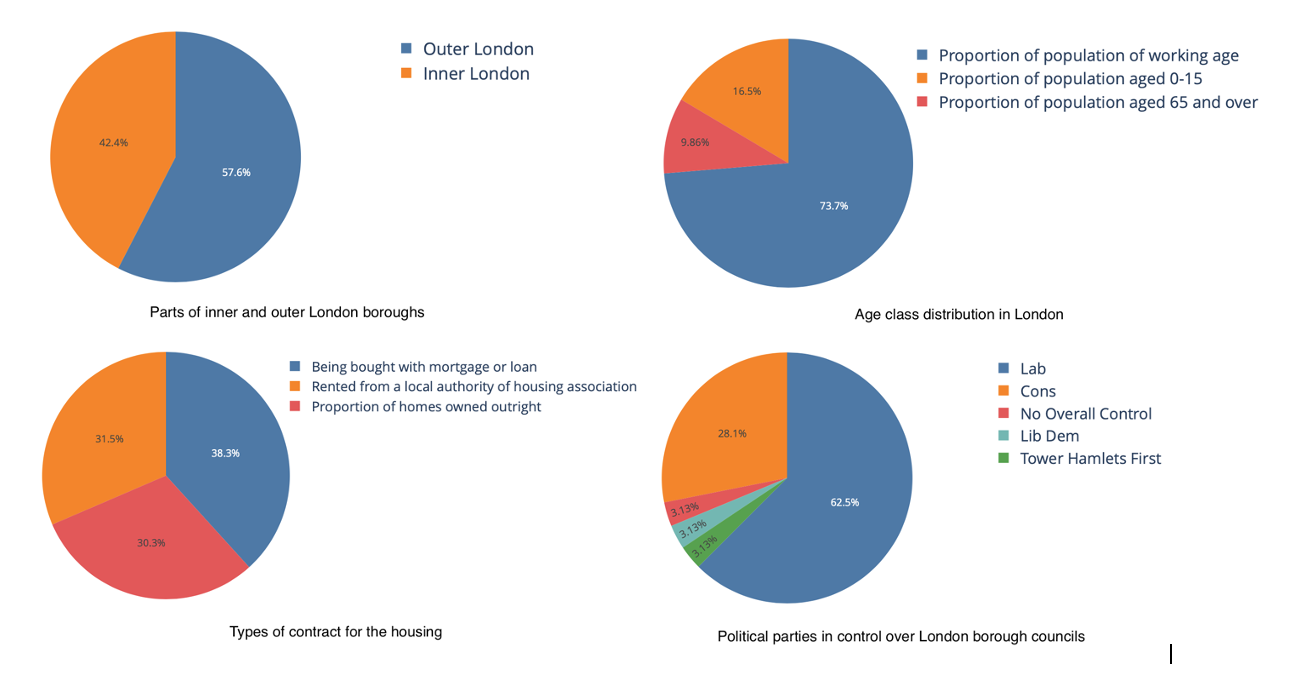
Let’s first have some insights on the data we have. We have information for the 33 boroughs of London. They are all classified as inner or outer boroughs.
We also know the age distribution over all boroughs which can be divided into three classes: 0-15 years old, working-age, and over 65 years old.
Housing can be separated into three categories, based on how the homes were acquired. These three classes are: homes owned outright (that is, full price was paid with the household’s own money); homes bought with mortgage or with a loan; homes rented from a local authority or a housing association). We can see in the third pie chart below how housing is shared among these three classes.
As we are also interested in the political control in council, let’s visualise the share of neighborhoods controlled by each party.
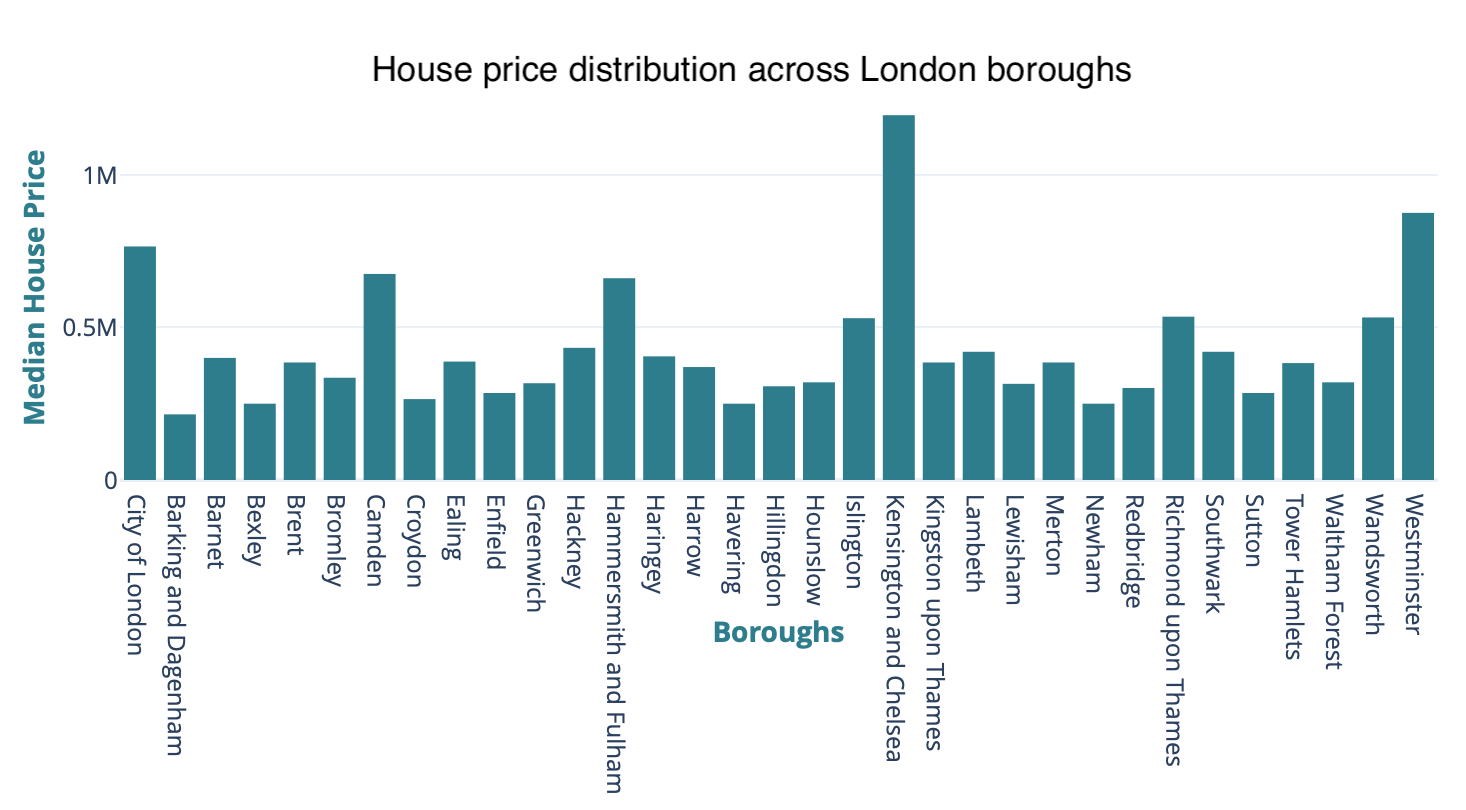
Let’s also have a look at housing prices across the boroughs. We see that one neighborhood in particular shows particularly high prices for housing: Kensington and Chelsea. This neighborhood is considered to be one of the most expensive in London, and the housing prices in this borough clearly reflect that.
And last but not least, we take the four variables that follow as defining the overall well-being of inhabitants of each borough:
- Life satisfaction score
- Worthwhileness score
- Happiness score
- Anxiety score
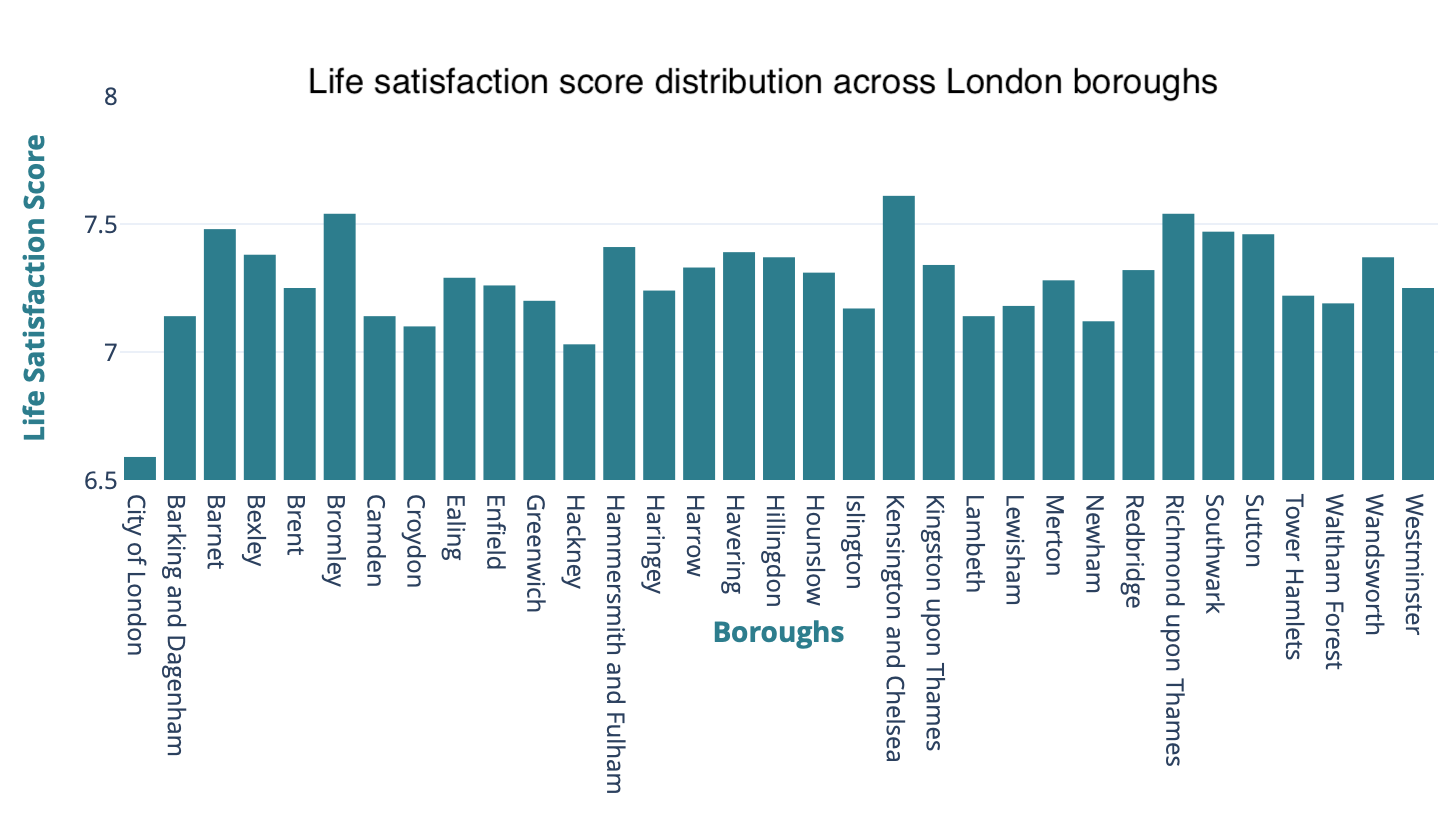
Let’s see if they are any different between the boroughs. First looking at the life satisfaction score, we see that all boroughs have a score between 7 and 7.6 out of 10. Except for the City of London, otherwise all boroughs are within the same range. Why is the City of London so different? Let’s see if it’s an outlier for the other three scores.
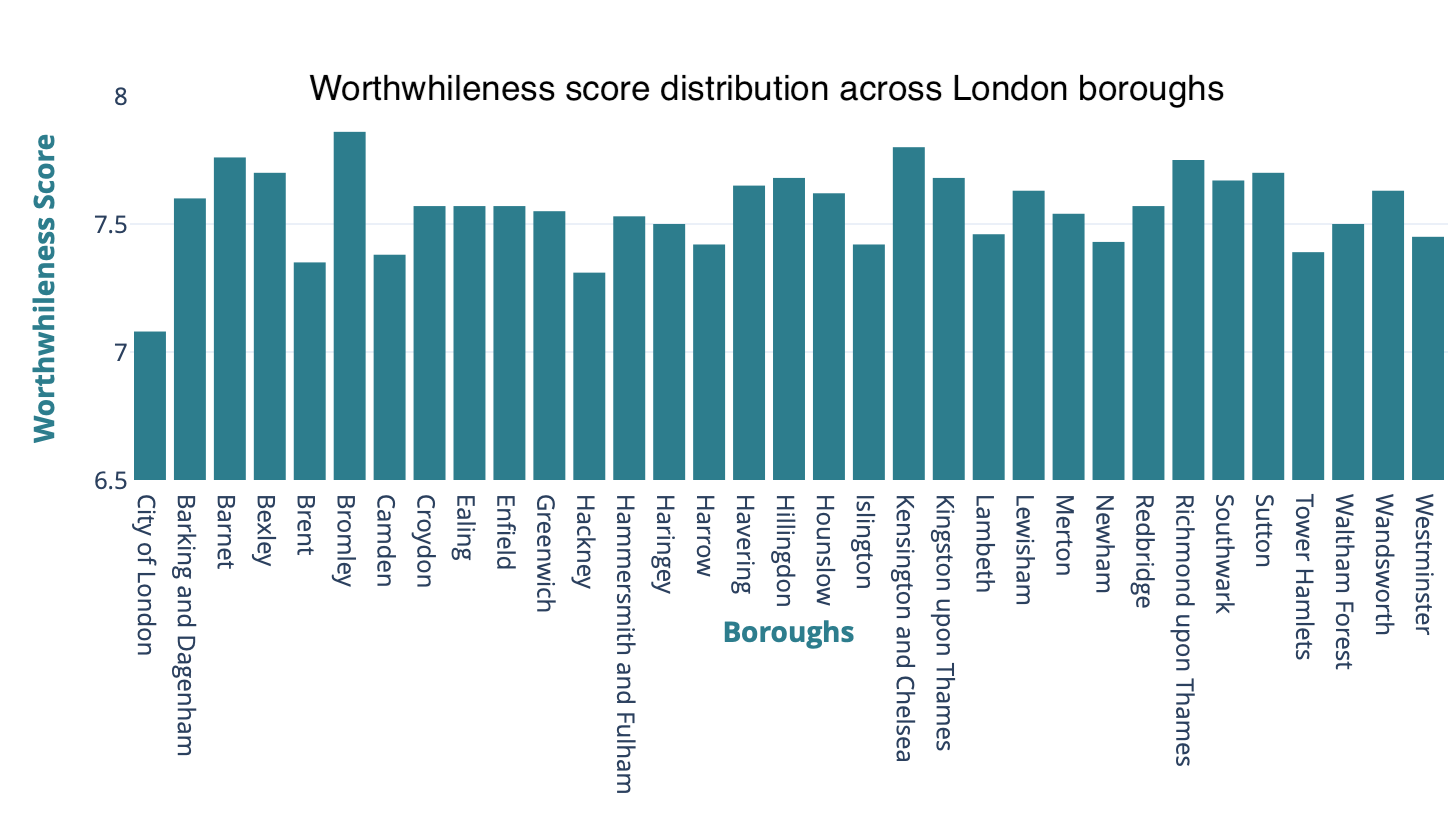
Let’s now have a look at the worthwhileness score across the London boroughs. Here, all boroughs have a score in the same range, around 7.5 out of 10, while again the City of London is quite different from others with a score closer to 7.
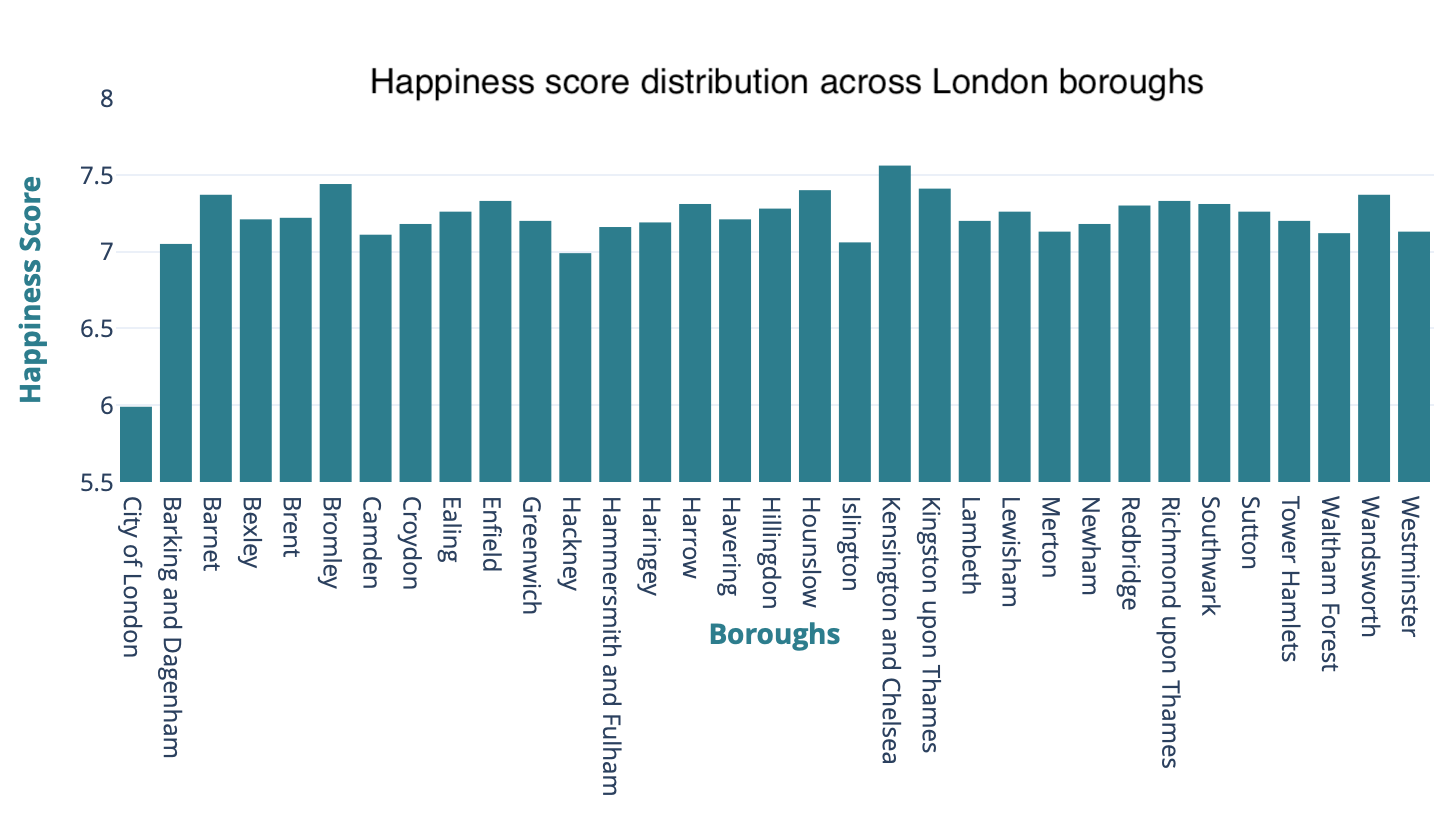
The happiness score is distributed in the same way. If all boroughs have a happiness score around 7.25, the City of London is the only one with a score inferior to 6.5.
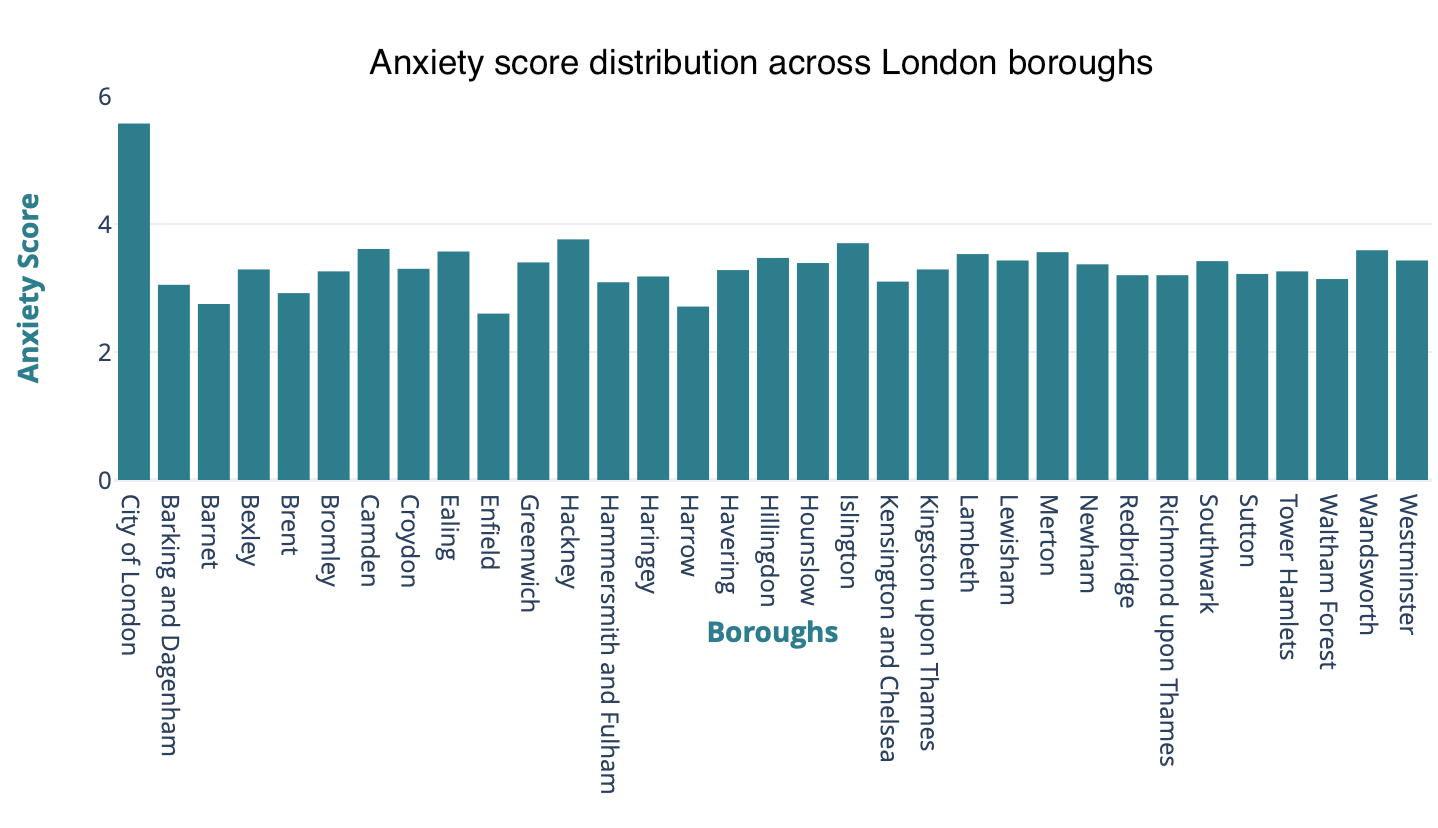
The difference between the City and the other neighborhoods is even more clearly visible concerning the anxiety score . The City inhabitants have an anxiety level almost twice as high as the other boroughs, with a score of 5.57 out of 10, and a mean anxiety score across boroughs of 3.3.
To conclude, we see that the overall range for these four well-being scores is quite small for all boroughs except for one outlier: the City of London. We will see if that will be visible through the second part of this work when we intend to group neighborhoods together based on life and housing conditions.
1. Location and well-being
Are you more satisfied with your life if you live in a particular borough of London? Are you happier or maybe more anxious? Are the inhabitants of Kensington and Chelsea, the most expensive borough of London, happier than others?
Let’s find out.
1.1. What could influence your well-being?
To discover what makes people satisfied with their life, we think about what could make people happy with their housing conditions. Let’s observe for instance the employment rate, the household income, the life satisfaction score, and the happiness score of Londong boroughs in relation to their location.
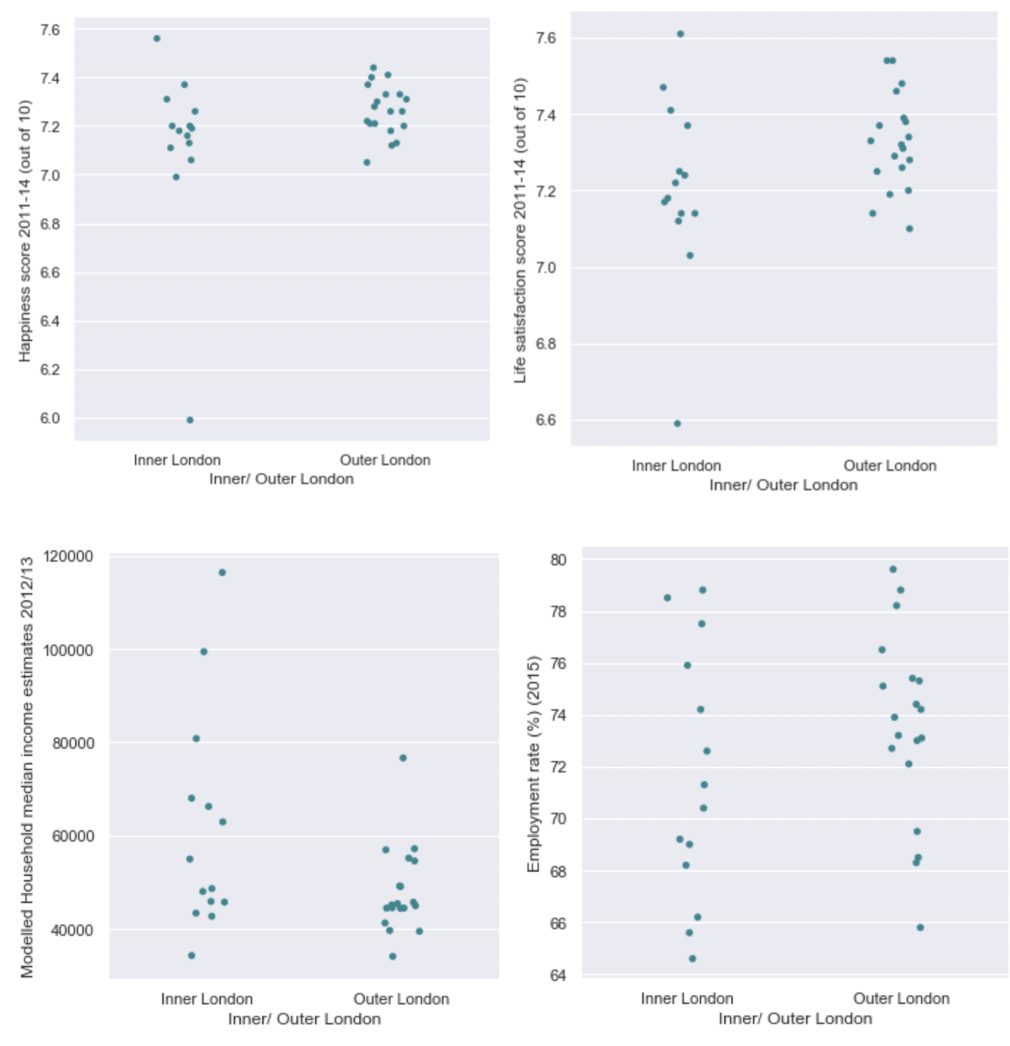
We can see that for happiness, life satisfaction and employment rates the distribution of the values seem to be very similar whether you live in Inner or Outer London. However, there is a much wider range of median household income for people living in Inner London compared to Outer London. Two outliers can always be seen in all 4 scatter plots: Kensingtons & Chelsea and City of London.
We identified several parameters to be of potential influence on your happiness, life satisfaction, worthwhileness, and anxiety. We can separate them into four groups: health, safety, income, and employment.
Now, get ready to discover how to be happy in London.
1.2. What really makes you happy
After some visual investigation, we could think that, for instance, people living in inner London boroughs are happier. So does your housing location really define your happiness and well-being? To answer this, we use different linear regression models. In model 1, we only tried to predict all four variables of well-being in function of whether the borough was located in inner or outer London. In model 2, we added the possible influence of health and safety in the neighborhood. In model 3 we additionally used the influence of employment rates and income. From this, we are able to conclude the significance and importance of parameters defining your life satisfaction, happiness, worthwhileness and anxiety.
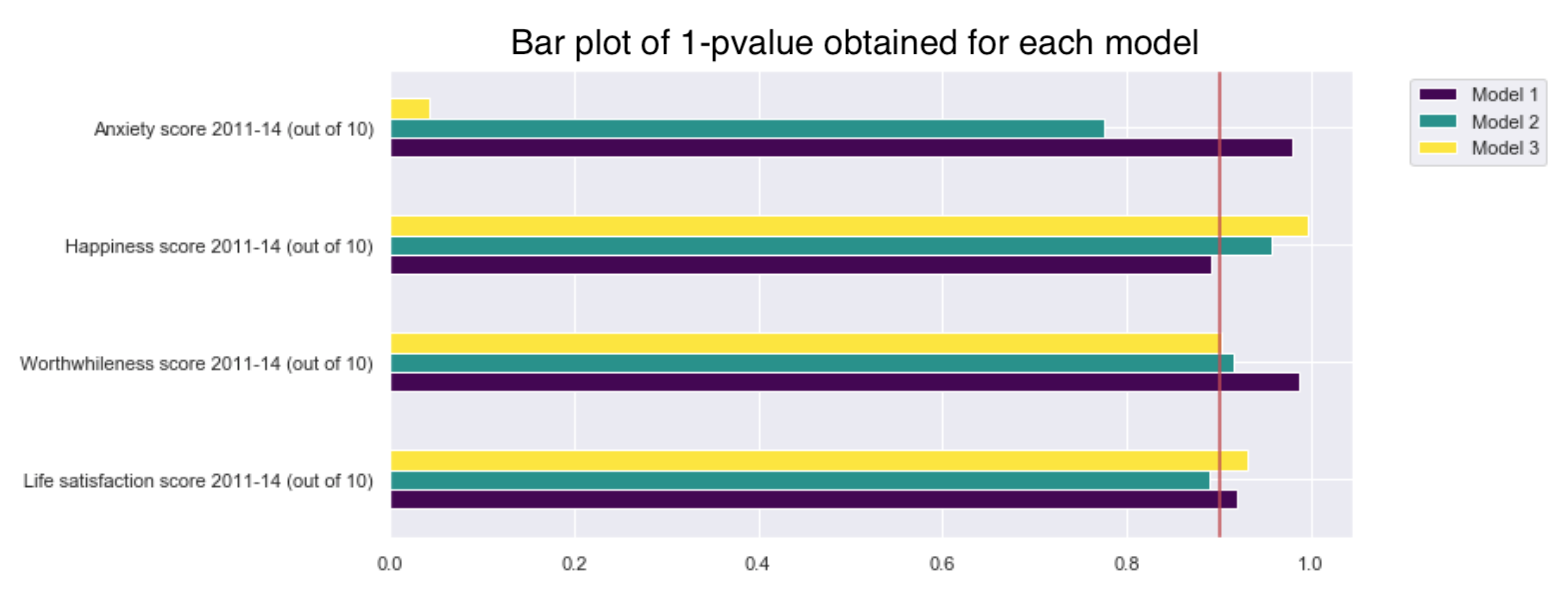
The red line on the histogram is here to show you that any bar that goes further than it has a p-value of less than 0.10 (we chose to plot 1 - pvalue for visualisation reasons, so any bar going further than 0.90 corresponds to a pvalue inferior to 0.10), which means that location is significant to assess all these scores at a 10% significance level. We can deduce that the life satisfaction score, the worthwhileness score as well as the happiness score can be quite well predicted from location in all three models. Well, this means that all these scores can be predicted by location. Sorry folks, but people living in inner London are indeed happier!
However, anxiety is hardly predictable by your location, and is probably mostly influenced by other factors, so maybe try some other things than moving to a new borough to reduce your stress (it will probably cost less anyway).
We also wonder if the standard of living could also be used to predict well-being. We chose to test a prediction with the criteria of salary, median house price, crime rates and if the house was owned outright. Can any of these parameters predict the life satisfation score, happiness score, worthwhileness score or anxiety score?
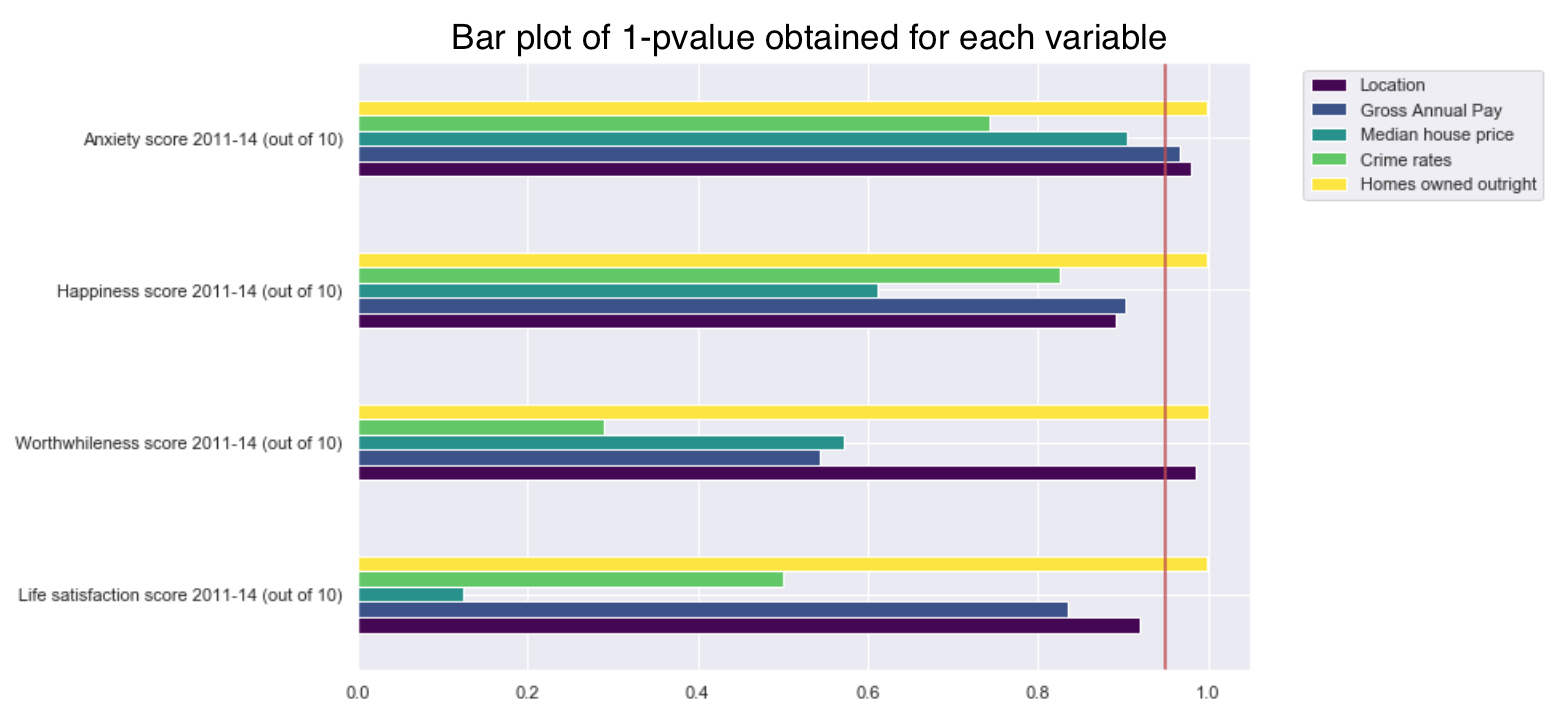 Here, the red line on the histogram is here to show you which p-values are lower than 0.05.
We see that the crime rates per thousand population alone cannot predict any of these scores, meaning that having high numbers of crimes in your neighborhood doesn’t affect your personal life (well-being) that much (well, until something happens to you).
For the median house price alone, we see that it is very efficient to predict the anxiety score, but not the other scores. A more expensive home leads to higher anxiety!
In terms of gross annual pay, it is not surprising to find that earning more money can significantly help reducing your anxiety. However, it doesn’t significantly influence your happiness, worthwhileness, or life satisfaction.
But what’s interesting here, is that how you own your house is a powerful predictor for all 4 scores. Having your home owned outright, that is, having full possession of your home (you paid all of it directly with your own money and received no loan) has a significant influence on your life satisfaction, happiness, worthwhileness and anxiety. Having your homes owned outright results in higher life satisfactio, worthwhileness and happiness, and lower anxiety.
To conclude:
- Your location does define your life satisfaction, worthwhileness, and happiness, but not your anxiety.
- Some standard of living criteria such as annual pay, house price and how you own your home can also predict these scores.
In fact, we can say that well-being can be particularly defined by whether a home was owned outright and by location.
So to be one of the happiest persons of London, you should live in inner London and own your home outright! Simple, right?
But let’s go a bit further.
2. Neighborhoods
We found that location does define your happiness and well-being. But are neighboorhoods that different? Can we find some differences so important that they define clusters of boroughs?
2.1. Finding borough groups
What could make your neighborhood so great compared to others? We select some factors that could help us identify boroughs with a lot in common. We selected the happiness and anxiety scores, as well as the employment rate, the household income, and the crime rates. These variables were selected to study the differences between neighborhoods in terms of well-being, security and economic stability.
Now, let’s dive into the real stuff.
2.2. How are these groups defined?
It is quite possible to group neighborhoods by looking at well-being, security and economic stability. We were able to find 5 groups of boroughs. By going back to the original data, we can show the groups using a map of London. Here is a map where each borough is colored in the cluster to which it belongs after the clustering methods.
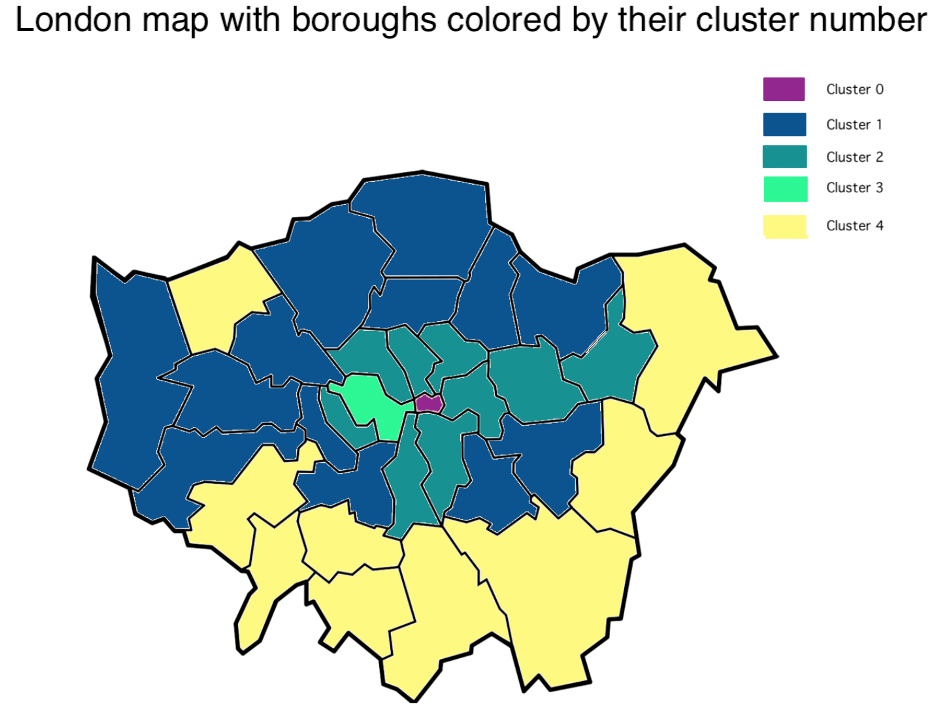
Well, we find that boroughs that were clustered together usually belong to the same London region ( inner/outer london , geographic location )! This is interesting as we didn’t use the location information to form the clusters: it means that the variables used contain information that can be thought as redondant to the location information. Concerning the three big groups (that is, the clusters with more than one borough), we can also have a look at the differences for the variables chosen, such as mean differences. This could be further investigated through some statistical tests, but we do find that the neighborhoods in each cluster are quite different from each others when comparing the means for multiple variables available (such as crime rates, employment, well-being).
But, what are these two lonely neighborhoods?
Two neighborhoods cannot be linked to any others. Why?
If they are flying solo, it must be because they are very different from the others! Let’s find out why …
The first outlier is the City of London . This does not mean London as a whole, but rather the historical and central primary business center of London. This a major business and financial center, mostly consisting of companies and business group headquarters. Its characteristics are quite different from other boroughs, but what makes it that different? In comparison to the overall data for the other boroughs, we found that the City of London is an outlier for happiness and anxiety scores used in this part of study. Indeed, it is an extreme borough for all the well-being variables, with the lowest happiness, life satisfaction and worthwhileness scores, and the highest anxiety scores, as can already be seen from the distributions shown ealier.
We see that the City is different from other boroughs, particularly concerning the well-being of its inhabitants. This explains why the City of London can’t be associated to any other borough.
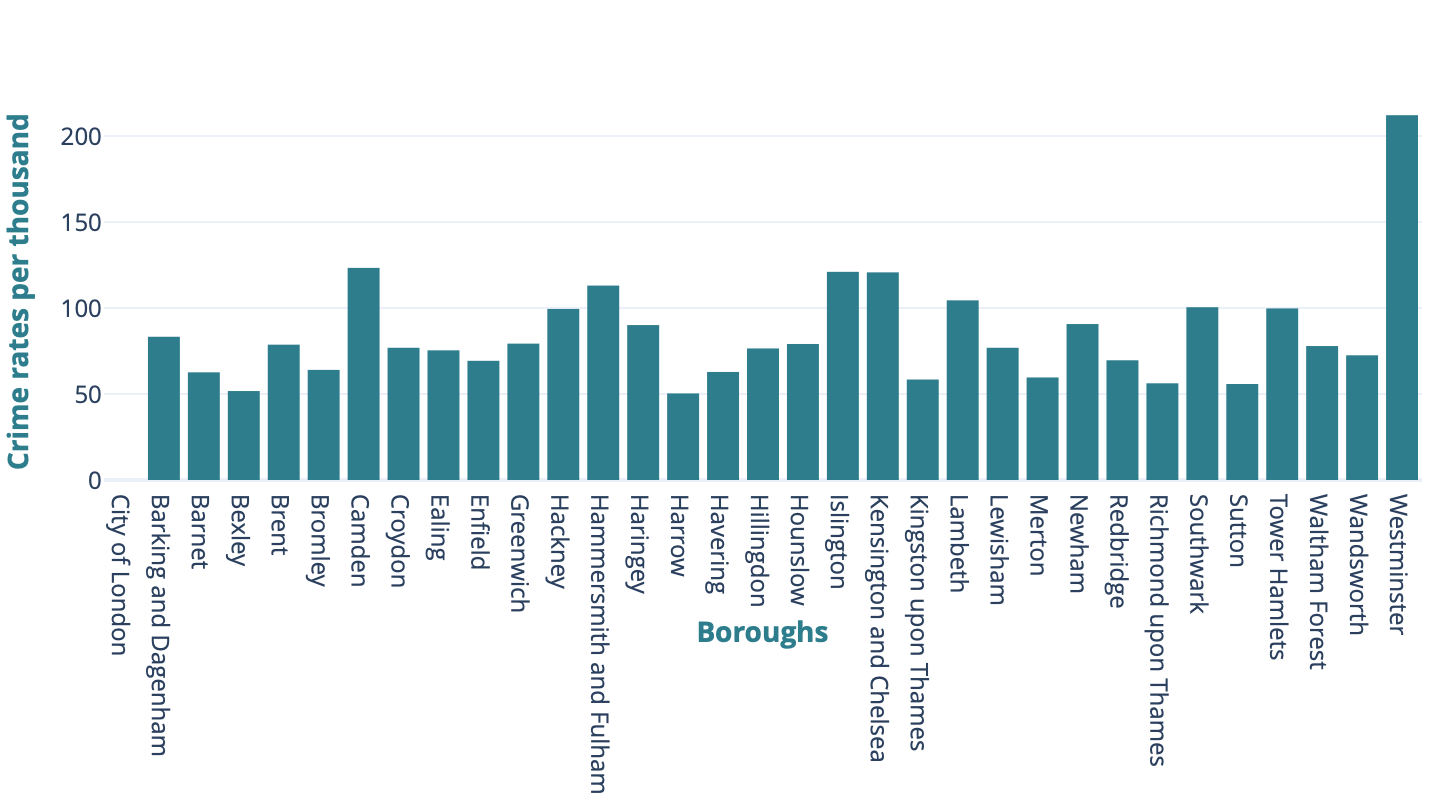
The second outlier is Westminster . A very touristic borough with high frequentation rates, where the Westminster Abbaye and the Big Ben can be seen. But what makes it so different from others? Westminster borough is actually quite normal compared to the overall data of the other boroughs. But if the large majority of parameters are within the normal range, one variable is particularly high in this borough: the crime rates. The crime rates per thousand population in Westminster is almost 3 times higher than the london mean crime rates per thousand population. This added to the tourists everywhere probably doesn’t make it a great place to live in London …
If we did find some borough clusters, we see that it isn’t easy to group the neighborhoods in very distinct clusters. This is not really surprising, as real human data is usually defined by many variables, and they are probably not all included in that analysis.
To conclude, it is possible to group London neighborhoods, showing that well-being, security and economic stability together are important life components that create some differences between neighborhoods in London.
Until now, we found that location, standards of living, neighborhood and housing conditions can all help predict your happiness and well-being, and lead to significant differences between boroughs. We know what this means for you: happier, less anxious, in short, you now have all the keys to have a better life!
But what does all this mean for the powerful political men and women of London? Are your political opinions linked to your neighborhood conditions?
3. Policital control in council
Let’s visualize some information how the political parties control is distributed across boroughs after the 2014 election.
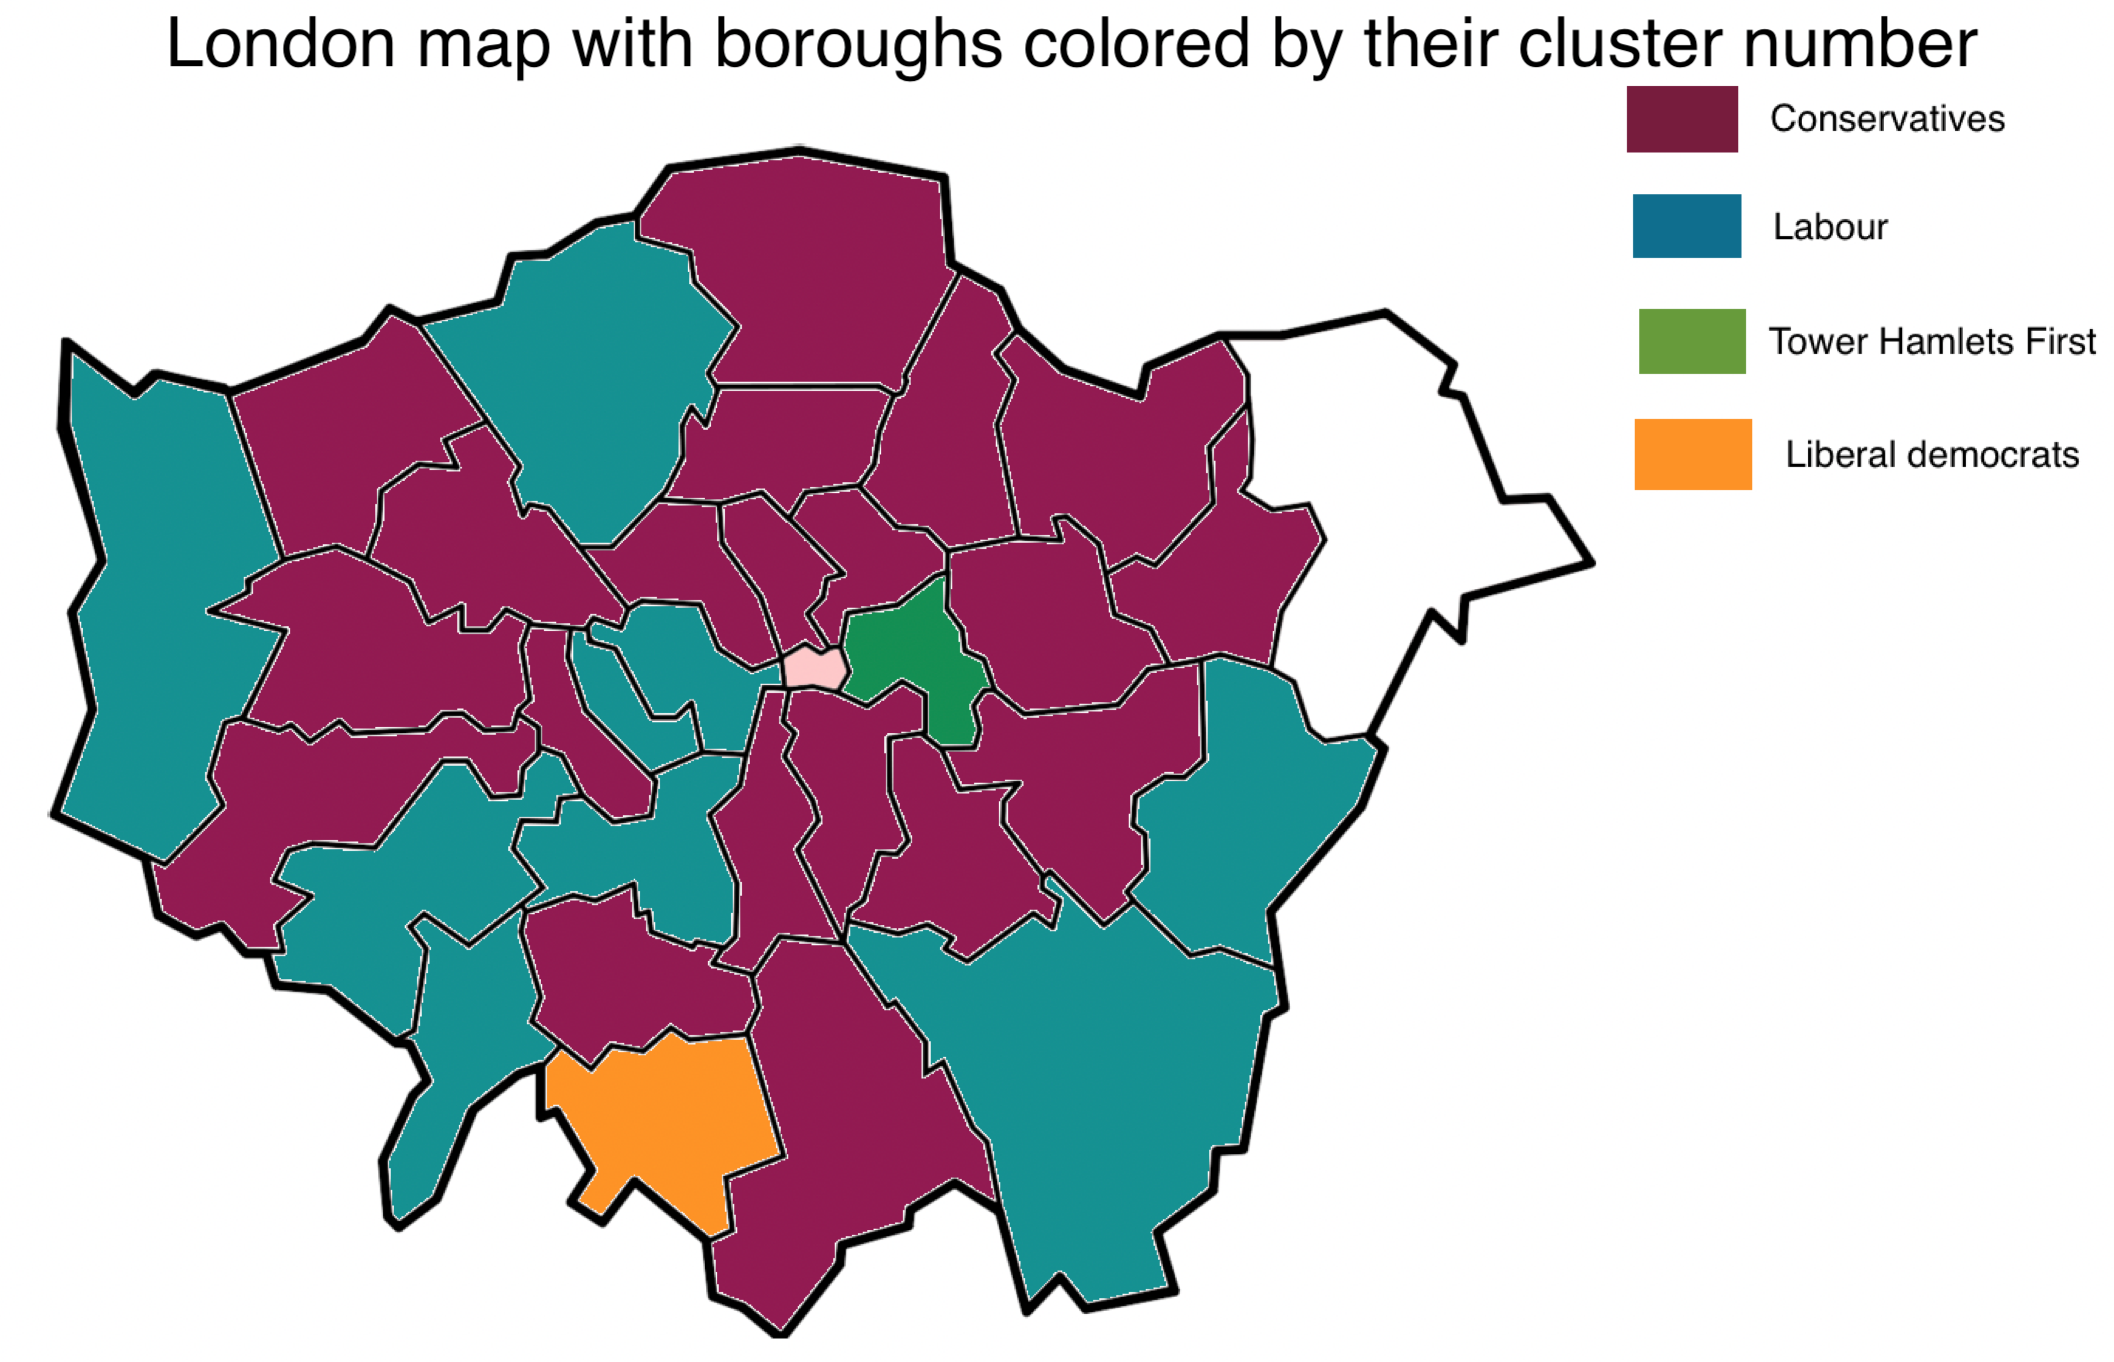
Visually, there does not appear to be any pattern of political parties in control across London. For this analysis, we will restrict ourselves to the two major londonian parties, the Labour and Conservative parties.
The question is, can we identify the variables that could influence why a party has the control in council in a neighborhood? That is, can we observe meaningful differences between boroughs with different political controls? Let’s find out.
3.1. Boroughs with Labour political control and Conservative political control
Are neighborhoods election results linked to the conditions in the neighborhoods? To identify potential differences between the neighborhoods voting for the different parties, we observe the mean for multiple variables, with an analysis divided into two parts:
First, we will look at the four well-being indices (life satisfaction, happiness, worthwhileness and anxiety), to investigate whether there are some significant differences in well-being between labour-controlled and conservative-controlled boroughs.
Then, we also chose several other variables that could have a potential influence on those four well-being scores in order to check if there are other differences.
We want to see if the variables selected show a mean difference between the two political groups of boroughs. We visualised if the characteristics with potentially different means from the two parts above are indeed differently distributed between labour boroughs and conservative boroughs. As an example, here are the distribution of the four well-being variables:
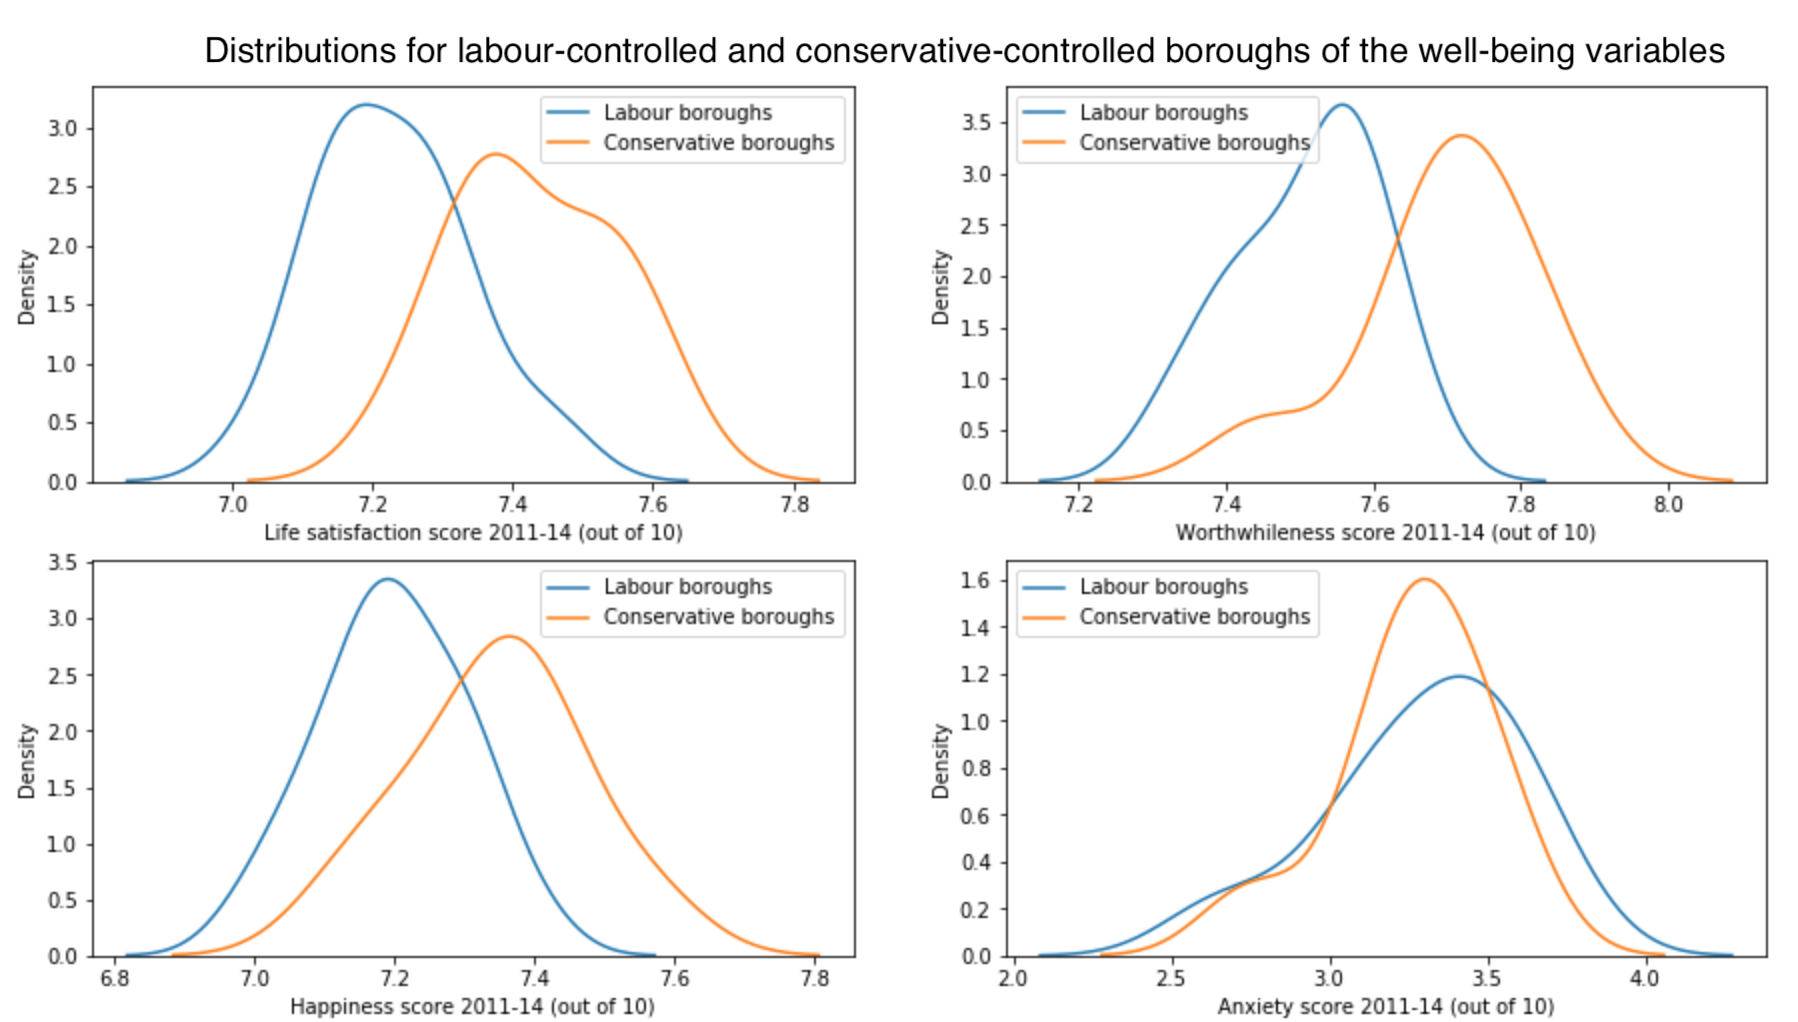
For these four scores, it seems that there are some differences for the life satisfaction, happiness and worthwhileness scores, but not for the anxiety score, which seems to follow quite the same distribution for labour-controlled and conservative-controlled boroughs. We reproduce the same visualisation for all variables selected and derive the same type of conclusion each time.
In the end, we found that a lot of parameters seem to have different distributions for the two types of boroughs. We need to verify if these are significant differences.
Let’s do it!
3.2. Are there significant differences for boroughs with different parties in control?
Visually, we have established the parameters susceptible to be different between labour-controlled boroughs and conservative-controlled boroughs. But can we trust our eyes? We run some statistical tests to check if indeed we can find some statistical differences between the boroughs controlled by the two parties. Here’s what we obtain, for the four well-being variables:
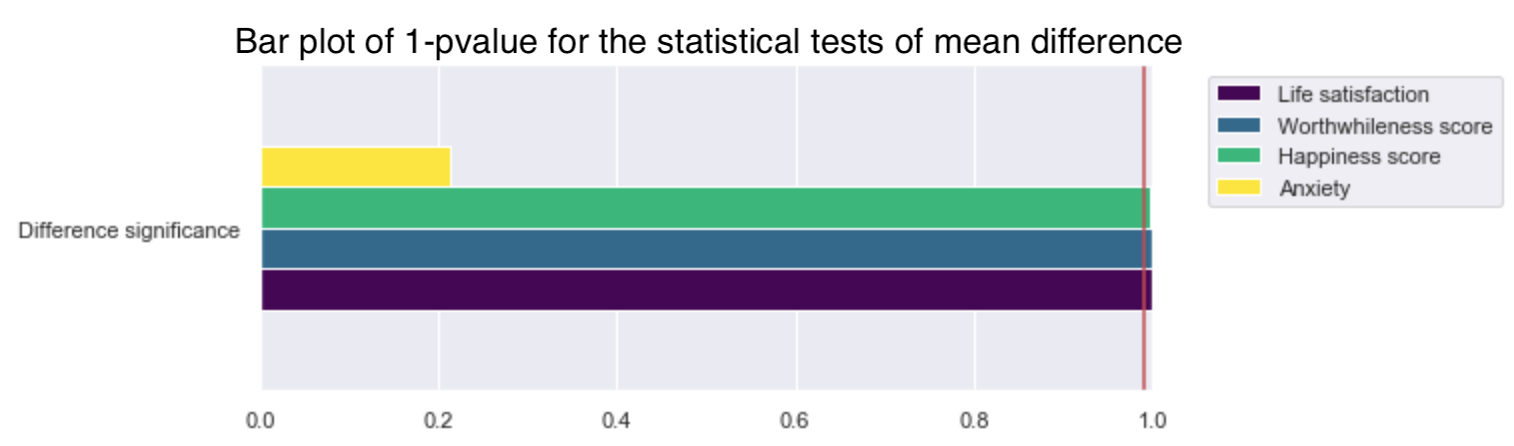
We used the same choice of visualisation as in the part 1 of our study, by plotting 1-pvalue. However here the red line indicates the 0.99 value, meaning that any bar going further indicates a pvalue lower than 0.01. We see that indeed, as expected from the distribution seen before, happiness, life satisfaction and worthwhileness means are significantly different between the two political types of boroughs, at a signifiance level of 0.01. However, it is not the case for the anxiety score, as expected from the distribution.
We repeated the statistical tests with the other variables of interest mentioned before, and here’s what we obtain:
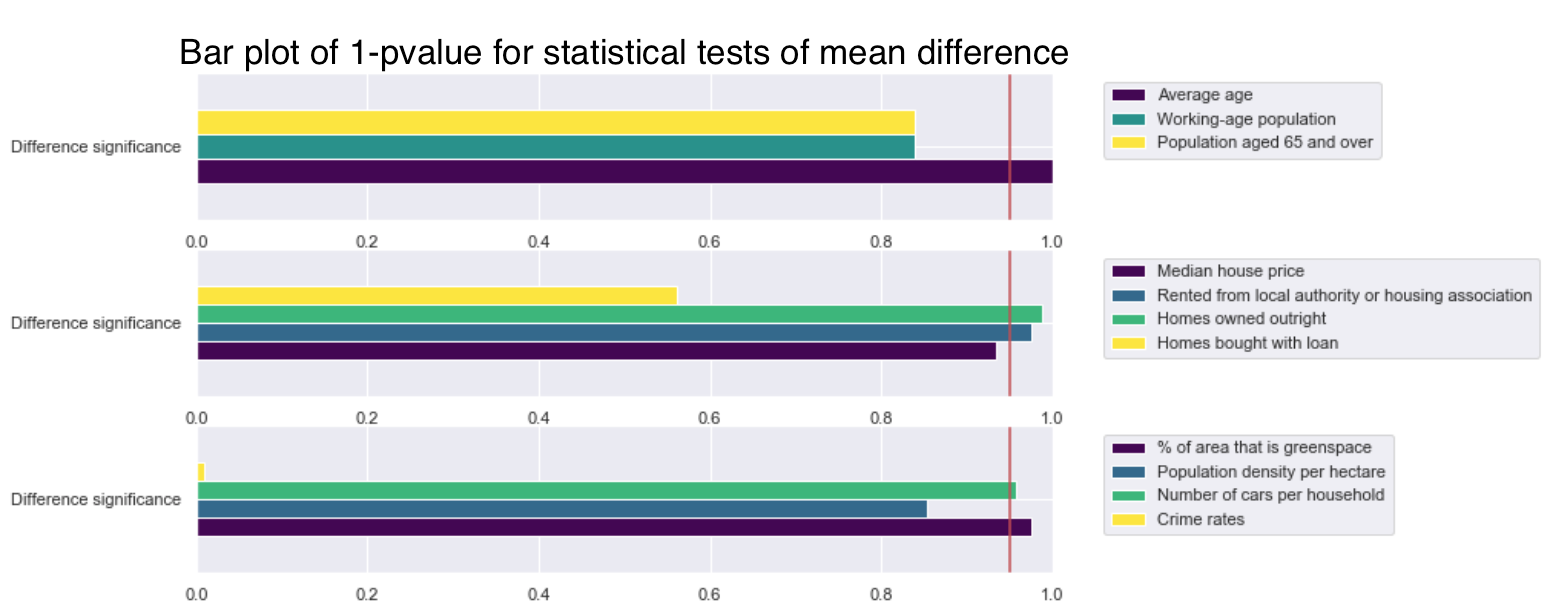
Here we used a significance level of 0.05, and we find that the average age, the proportion of homes owned outright, the proportion of homes rented, the greenspace area and the number of cars per households, are all signicantly different between the two groups of boroughs: labour and conservative.
So we see that indeed, boroughs with different political controls are characterized by different parameter values! If some of these differences can be explained by the fact that they are known to exist culturally and socially, some variables that we would expect to be significantly different aren’t (such as the proportion of people aged 65 and over, expected to be higher in conservative boroughs for instance).
Also, we didn’t expect to have such strong statistical differences between the two groups for the life satisfaction, happiness, and worthwhileness!
But what’s the interest of all this?
Would it be possible to go further?
Collecting year-corresponding data from the variables that seem to have significantly different values in labour and conservative boroughs could be used to develop a prediction model, allowing politicians to visualise which neighborhoods they can hope to win based on the life and housing conditions in these neighborhoods.
It’s also important to take into account the fact that each of these variables tested for significant differences are very influenced by other variables, not even all included in this analysis and data. A more complete analysis of interactions between variables could help investigate the causes of these differences, and why not to solve them? Here’s a job for the politicians: to find solutions to these inequalities!
So… What does this mean for us?
As students of EPFL, we are still relatively young and we wonder where our lives will take us. But as we make the decisions in the coming years that will shape our future, we wanted to understand what we should take into consideration when choosing a place to live.
We dived deep into London, its geography and its inhabitant’s well-being and we searched high and low for clear correlations between standard of living criteria and high scores for happiness, life satisfaction or even worthewhileness.
And we found something fascinating as we obtained very clear results showing that your living conditions (location, standard of living) can have a significant influence over your overall well being as well as your political affiliations.
However, what do we do with all this now ? We think the fair answer is… not much !
We may have uncovered one of the many criteria for happiness, but the recipe to be truthful is probably much more complex.
However, location may still bring you one step closer to a higher overall well being!
So, now that you know all this: Where are you moving to?